Mapping and database visualization
The definition of visualization is a gather science, statistics, and graphics. It has only been recognized as its own entity since the 1985-1990s. It is all begin with seminal work is in line with that of a young field. But its discover that they are good in background drawn from years of statistics and graphic design.
Mapping
The definition of mapping is making a map, or a matching process where the points of one set are matched against the points of another set, if to define it can be say mapping is the act or process of making a map.
Information Visualization
The field or information visualization has appeared “from research in human-computer, computer science, graphics, visual design, psychology, and business methods. Human eye’s can through visual to allow users to see, explore, and understand large amounts of information at once. Thurs, it is take advantage on visual representations and interaction techniques.

Image 1 (Information Visualization)

Image 2 (Information Visualization)
Organic Information Visualization is considered a space of highly complex systems for which we lack deep understanding because few techniques exist for visualization of data whose structure and content are continually changing. To prevent make it more complicated, the resulting systems employ simulated organic properties in an interactive, visually refined environment to glean qualitative facts from large bodies of quantitative data generated by dynamic information sources.
Organic Information Design is information design based on organic systems.

Image 3 (Organic Information Design)
Data visualization
Data visualization as story-telling, there is a process call data-driven journalism in a similar manner, the data must be found which may require specialized skills like MySQL or Python, then find out for which understanding of jargon and statistics is necessary, and finally visualized and mashed with the aid of open source tools. Maps are probably the biggest subsection of visualization types. There are many variations on map types, each with its own strengths. These variations can be combined with each other, and many can be improve even further to produce new types of maps. There are many types of maps such as Choropleth, Cartograms, Proportional Symbol, Pinpont, Connection, Subway, Isopleth, Stream plots and Prism.
“Choropleth” maps are one of the most frequently used maps in infographic style visualizations. As the name suggests, color is the important part to these maps. A color scale is assigned to numerical data, and the value for each region is used to color the region.

Image 4 (Choropleth)
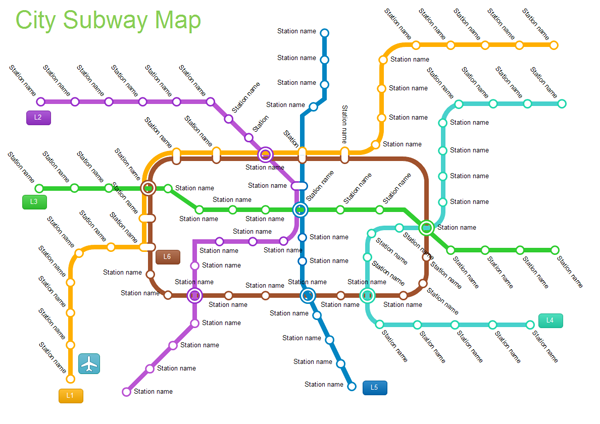
Subway maps are another version of connection maps. The connection is most important in these maps, although the precise station location is not. Furthermore, there are a lot of information on the subway map to stated which station that you need to stop and to take which which train and bus to next destination. Subway and transit maps are always manually created by designers who simplify the routes down to lines at a few different angles.

Image 5 (Subway)
Bilbiography
- Data-driven journalism, Wikipedia, the free encyclopedia. 2015. Data-driven journalism- Wikipedia, the free encyclopedia. 2015 [ONLINE] Available at: https://en.wikipedia.org/wiki/Data-driven_journalism
- How to use Maps in Data Visualization – Drew Skau. Design. 2012. How to use Maps in Data Visualization – Drew Skau. Design. 2012. [ONLINE] Available at: http://blog.visual.ly/you-are-here-using-maps-in-data-visualization/
- Information Visualization – Wikipedia, the free encyclopedia. 2015. Information Visualization – Wikipedia, The free encyclopedia. [ONLINE] Available at: <a href=”https://en.wikipedia.org/wiki/Information_visualizationhttps://en.wikipedia.org/wiki/Information_visualization</li>
- Organic Information Design – Benjamin Jotham Fry. 2000. Organic Information Design, Benjamin Jotham Fry. [ONLINE] Available at: http://benfry.com/organic/thesis-0522d.pdf
Image Credits
Image 1 – http://netdna.webdesignerdepot.com/uploads/visualization_tools/liveplasma.jpg
Image 2 – http://thumbnails-visually.netdna-ssl.com/the-insane-choices-you-face-at-the-drug-store_50290d8169646_w1500.png
Image 3 – http://www.michaelogawa.com/code_swarm/eclipse-640px.png
Image 4 – https://paultheonlyone.wordpress.com/wp-content/uploads/2015/06/e9d54-standardizedcmap.png
Image 5 – https://www.edrawsoft.com/images/examples/city-subway-map.png
